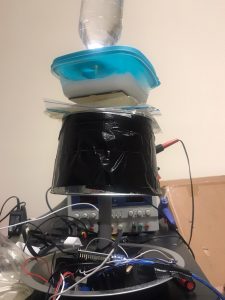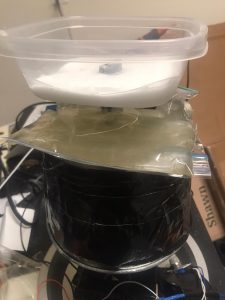
Carbon dioxide is generated in the top compartment. A vinegar dripper is inserted on top of baking soda. As discussed earlier baking soda and vinegar will generate CO2.

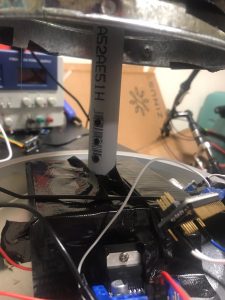
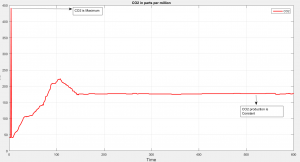
The PVC pipe has holes in it which will be a vent passage to CO2. I used MQ-135 Sensor for Identifying the presence of CO2. The Data is generated and the graph is visualized using Matlab.

The Graph of CO2 shows that in the beginning the CO2 ppm is around 32 and it got raised to 450ppm due to over dripping but gradually the dripping slowed down to 2 min per ml. Hence the graph became constant at 170-175 ppm.

CO2 in PPM vs Time in Sec
