Solenoid: Heat Vs Power Consumption
The solenoid vibration unit was heating up extensively in our previous experiments. To understand the vibrations the data was generated. TMP36 was used in this process to collect temperature data of the solenoid.
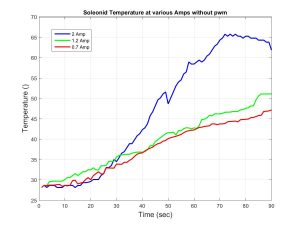
The temperature of the solenoid varies with changing amperes, the following graph shows the change in temperature with respect to current.
Solenoids are not working below 0.7 amps. So, I opted 0.7 to be the least current input. But the problem is that the vibrations are not as strong as expected in at this rating.

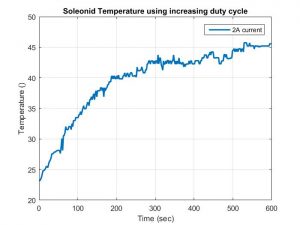
To avoid this, we are using the PWM technique to control the solenoid at a minimum temperature. First, the solenoid was operated by increasing the duty cycle. The graph below shows the variation of the temperature in the solenoid, The graphs increasing duty-cycle is heating up just like the above graph.

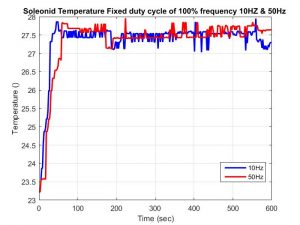
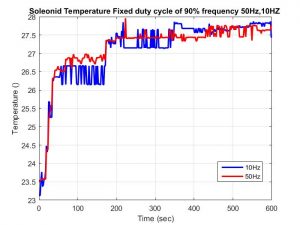
Therefore, a constant PWM pulse is used, but the graph shows pretty good results, at 10Hz and 60Hz, The solenoid was not operating above 60Hz of frequency. Power Consumption graph is also generated. Duty cycle 100% and duty Cycle at 90% are tested to see which one give an optimum result. It shows that both are doing pretty good results in terms of heat generation.


Conclusion: Heat was a problem when the solenoid was used but that can be solved by using PWM pulse duty cycle at 100 at 50Hz to have minimum heat dissipation.
